
A few people have commented to me recently that the lake is “really down!” That prompted me to look into some data to see if I could corroborate their observation.
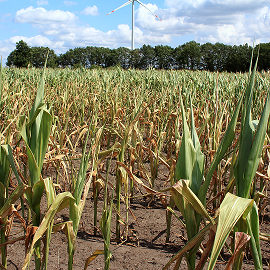
When you picture dry conditions, you probably visualize this ………………..
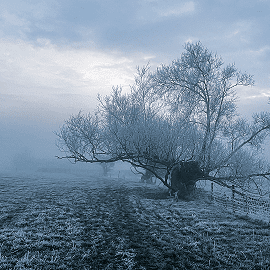
…….. but not necessarily this.
According to weather.gov
“Precipitation saw a wide range of values across the area this past month as parts of northern Illinois recorded rainfall amounts over an inch above normal while central Illinois and northwest Indiana recorded below normal precipitation.”
Actually, we have been stuck in a La Niña pattern for a while now.
La Niña refers to the periodic cooling of ocean surface temperatures in the central and east-central equatorial Pacific. This typically occurs every 3 to 5 years or so and represents a cool phase of the El Niño/Southern Oscillation (ENSO) cycle.
During a La Niña event, the changes in Pacific Ocean temperatures affect the patterns of tropical rainfall from Indonesia to the west coast of South America. These changes in tropical rainfall patterns affect weather patterns throughout the world.
La Niña is back again for a rare triple-dip this winter, which means this is the third year in a row that the U.S. will experience La Niña conditions. This can mean drier-than-normal conditions across a lot of the country.
Definition of a Drought
Merriam-Webster Dictionary: “A period of dryness especially when prolonged.”
American Meteorological Society: “A period of abnormally dry weather sufficiently long enough to cause a serious hydrological imbalance.”
NOAA’s National Weather Service: “A deficiency of moisture that results in adverse impacts on people, animals, or vegetation over a sizeable area.”
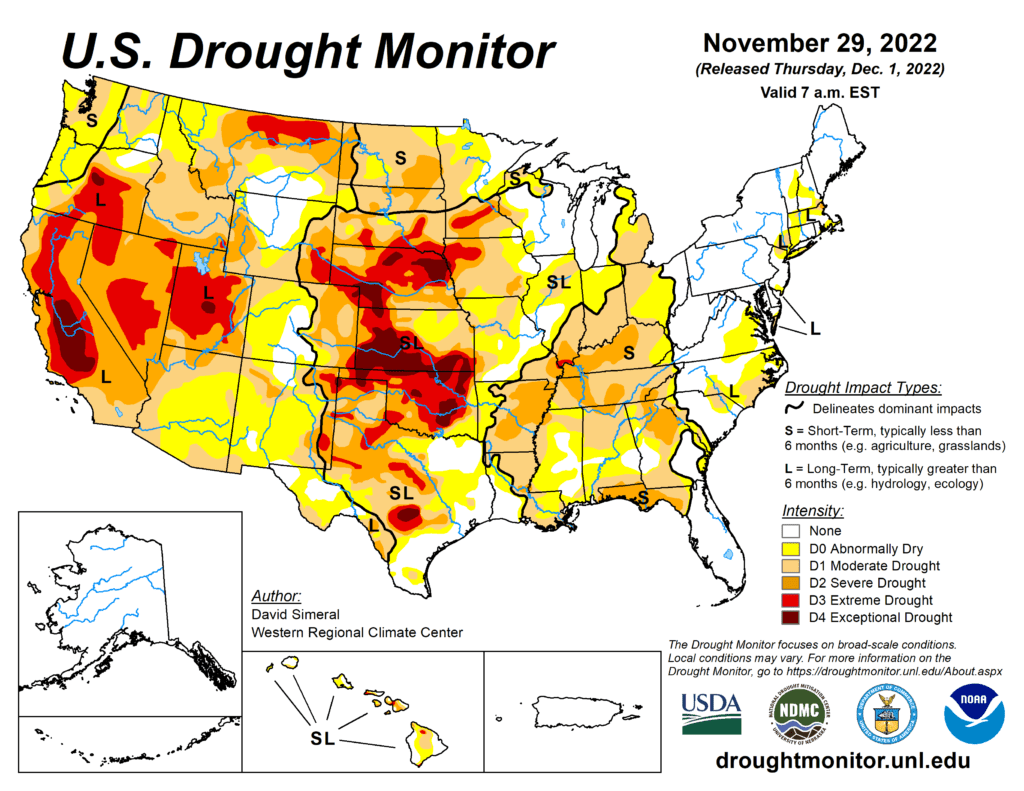
As you can see on this map, northern Indiana is in the Abnormally Dry category, while the rest of the state is classified as D1 – Moderate Drought.
What does this do to the level of Lake Maxinkuckee? I checked the lake gage online and recorded the lake level for December 5th for the past ten years. You can check it for yourself:
LAKE MAXINKUCKEE AT CULVER, IN – USGS Water Data for the Nation
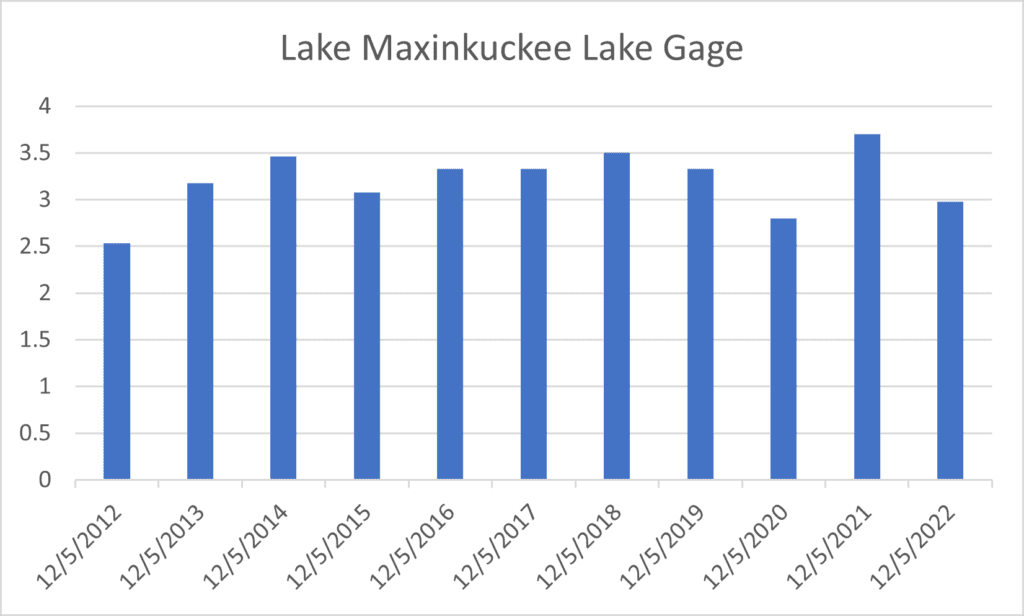
Just for fun, I compared today’s level with May 31st. Remember last spring when the water was so high that people couldn’t get their piers in? The level on that date was 3.86.
The ten year average on December 5th is 3.52
So that is why I titled this article “Fun with Facts and Figures.” Sometimes our observations can be supported by data. Yes, the lake is down from last year, and down from the ten-year average.
Thanks for the keen observation and good conversations. I never know where the inspiration for my next article will come from. Stop by anytime for a chat.

Hi, I’m Debbie Palmer. I received a BS in Horticulture from Purdue University. Here at LMEF, I am responsible for outreach presentations, monitoring the lake and it’s wetlands, project manager for restoration and research projects, and act as a community resource for all things related to the well-being of Lake Maxinkuckee and its surrounding watershed. I completed Indiana Watershed Leadership Academy, volunteer with the Indiana Clean Lakes Program, Hoosier River Watch and Marshall County Lakes and Waters and serve as a Board Member for Indiana Lakes Management Society.
Recent Comments